Compare 190 years of wine history across twelve countries — production, consumption, trade and vine area, from the Anderson & Pinilla database. Charted in your browser, downloadable as CSV.
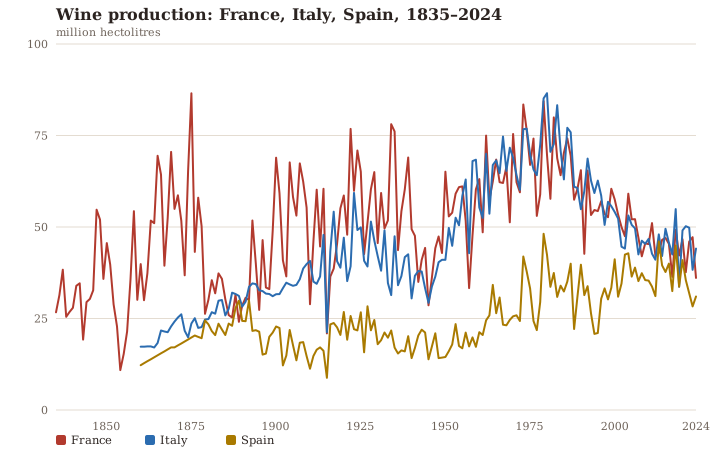
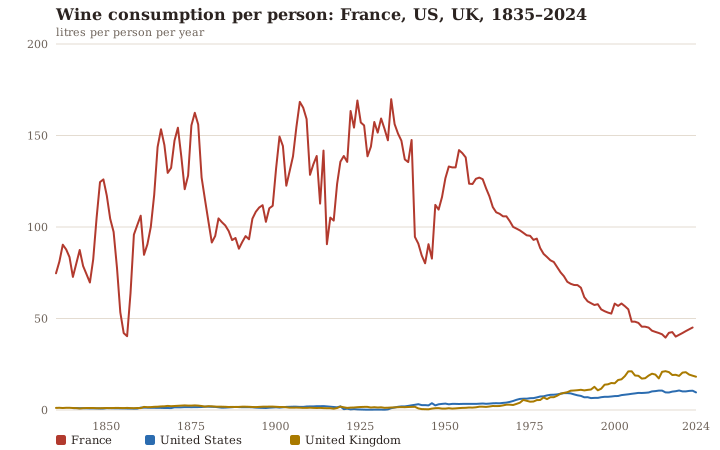
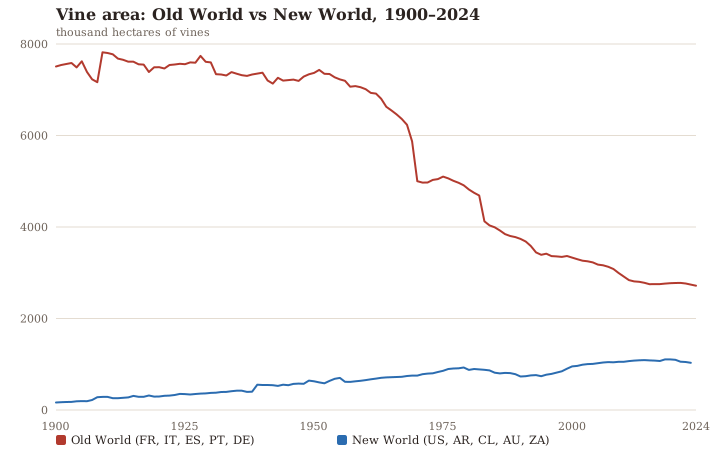
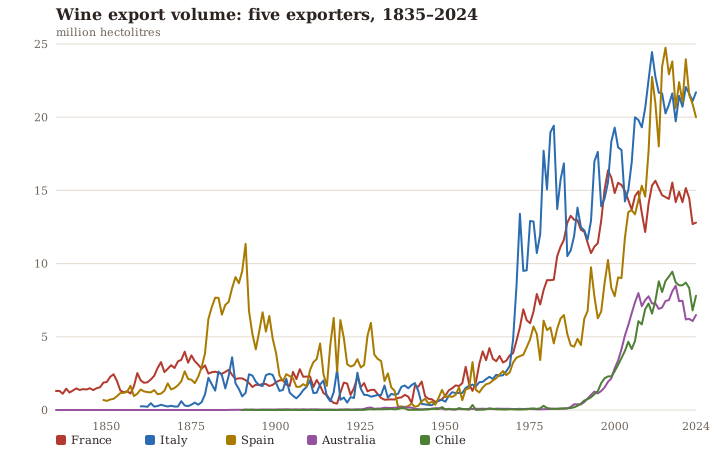
Annual wine production, million hectolitres, in the three countries that have led world output since the series begin (Italy and Spain enter the database in 1860). Spain 2022 is a gap: the source file's value fails its own consistency check and is omitted rather than corrected.Litres of wine per person per year. France at its interwar peak drank nearly 170 litres per head; the United Kingdom has never recorded more than 22 and the United States never more than 11.Total vine area (wine, table and drying grapes), summed over five Old World producers (France, Italy, Spain, Portugal, Germany) and five New World producers (United States, Argentina, Chile, Australia, South Africa) — only for years in which every country in the group reports.Annual wine export volume, million hectolitres. France led the mid-19th-century trade and Spain surged while phylloxera ravaged French vineyards; Italy and Spain lead today, with Australia and Chile the largest New World shippers in the series.
Data: Anderson, K. and V. Pinilla (with A.J. Holmes), Annual Database of Global Wine Markets, 1835 to 2024, Wine Economics Research Centre, University of Adelaide, April 2025. One source-file error is omitted (Spain 2022 production — see the dataset notes on the data page).